|
Overview
| Mathematical modeling and empirical analysis of Internet connectivity by Professor and author Albert-Laszlo Barabasi has demonstrated
that network evolution by "preferential attachment" leads to so-called power-law, aristocratic, or scale-free node degree distributions. In other words, the "rich" nodes get "richer" as new entrants
to the network preferentially decide to attach to them. For example, a new web site is more likely to link to Facebook, Google, or LinkedIn, than an unknown site. This simulation shows the difference between preferential attachment and random attachment, up to just over 1000 nodes, and
enables viewing of the resulting network from both a node degree distribution perspective as well as an actual graph.
|
|
Basic Flow
| First, select whether the graph should evolve by random (uniformly distributed across all priorly existing nodes) or preferential attachment. If random, nodes may grow according to a harmonic series. E.g., the first node in the network has a 50% chance of being picked by the third node, a 33% chance of getting picked by the fourth node, a 25% chance of
getting picked by the fifth node, and so on. If preferential, an early lead is most likely to translate into a dominant node degree later in the simulation.
Second, run any number of random trials, where each trial adds one or more nodes in accordance with the random attachment or preferential attachment protocol
Lastly, view the results. Results may be viewed as either a node degree bar chart or as an actual graph. The highest number of nodes allowed is 1080, which results in a very large graph. Some browsers automatically shrink
the graph, which may result in artifacts such as invisible lines, but clicking on the smaller version restores the entire graph which then may be perused in high resolution.
|
|
Select the Attachment Protocol
|
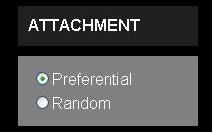
An attachment protocol of "random", i.e., uniform, or "preferential" may be selected. As each node is added in the next step, this choice determines whether all prior
existing connections are equally likely to get connected to the new node, or preferentially in proportion to their current "popularity," as measured by relative node degree.
|
|
Add Nodes
|
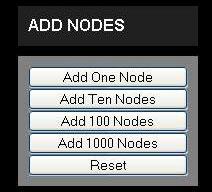
One or more nodes may be added at a time, up to a total of 1080 nodes. The "reset" button clears the values.
|
|
View Results
|
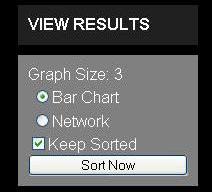
Results may be viewed as a bar chart or a graph, and may be sorted or unsorted. The default settings of "preferential attachment" and "sorted" "bar chart" lead to power-law distributions.
|
|
Network Graph
|
|
|
Bar Chart
|
|
|
About
|
This model was written by Joe Weinman in about 400 lines of code,
which are a mixture of HTML, DHTML, ASP.NET 2.0 / Visual Basic, stylesheets, and JavaScript, using Microsoft Visual Web Developer 2008.
It has been tested in Firefox 2.0 (Mozilla 5), Safari 3.1, and Internet Explorer 7.0.
|
|